
Build a self-updating landing page for your Python plots
Set-and-forget automation, with no paid software or complex web hosting.


Disseminating regular data reports and charts to your audience can be a chore.
Often, this involves manually updating and copying plots into a Word document or email. A more savvy approach is to create a web-based landing page that your audience can easily access. If your data extraction can be defined in a script (e.g., by calling an API), you can save even more time by automating website updates.
In this post, I'll demonstrate how to convert existing Python plotting code into a well-formatted landing page that updates itself daily (or at any interval you choose) with minimal effort.

With my approach, you don't need to rely on rigid BI tools, pay for third-party services, or web hosting. You won't even need to learn a web development language.
Here's what we'll cover:
A high-level overview of how it works
A step-by-step demonstration
Essential Quarto formatting tips
How to handle API keys (bonus for paid subscribers)
Subscribe and join 3k+ others to work smarter through automation and become a savvier analyst.
Consider upgrading to a paid subscription—it's great motivation for me to keep investing time and energy into these posts. My articles will remain free, but paid subscribers will occasionally get extra perks, including detailed code snippets for extensions and larger projects.
How it works
In addition to your Python plotting code, you'll need two tools: Quarto and GitHub Actions.
Quarto is a publishing framework that embeds Python code directly into web pages, rendering plots and tables seamlessly. This means you can simply copy your Python code into a Quarto markdown file (.qmd) and directly use Python libraries for creating charts.
In a previous post, I demonstrated the fundamental steps for creating interactive Plotly charts on a Quarto web page.
The key difference this time is that we want to automate both the data extraction process and the website updates.
Quarto works by rendering static HTML files, which can then be hosted as web pages via GitHub Pages. The manual workflow involves running quarto render locally before pushing changes to the HTML files in the docs folder to your GitHub repository.

To automate the three steps above, we'll use GitHub Actions, a powerful way to schedule cloud-based tasks for free—without needing your computer to be switched on.
We'll write a workflow file containing instructions to automatically run quarto render with your Quarto Markdown (.qmd) file at specific intervals (daily, weekly, monthly, etc.).
How does data extraction fit into this? In the upcoming example, the .qmd file contains your plotting code along with Python code that calls an external API. Thus, each time the scheduled task runs, it extracts the latest data automatically.1
Step-by-Step Demo
Before starting, I suggest reviewing my earlier posts covering the basics of Quarto and GitHub Actions:


In this post, I'll only cover the specific code snippets and steps relevant to automating a Quarto report. However, you can find the complete code and project files in this GitHub repository.
Step 1: Create the Quarto markdown file (report.qmd) and add your Python code snippets.
In this example, we'll be plotting daily stock prices. First, we need a Python code block that extracts data on key tech stocks using the ffn (Financial Functions) package.2 We temporarily save both raw and processed data files for later access.
Note: setting
output: falsemeans the code block won't show its output in the final document, andecho: falsehides the code snippet itself.

The second code block in report.qmd contains the plotting code using the Seaborn package. In theory, you could use plotting code from any Python visualization library you like here.
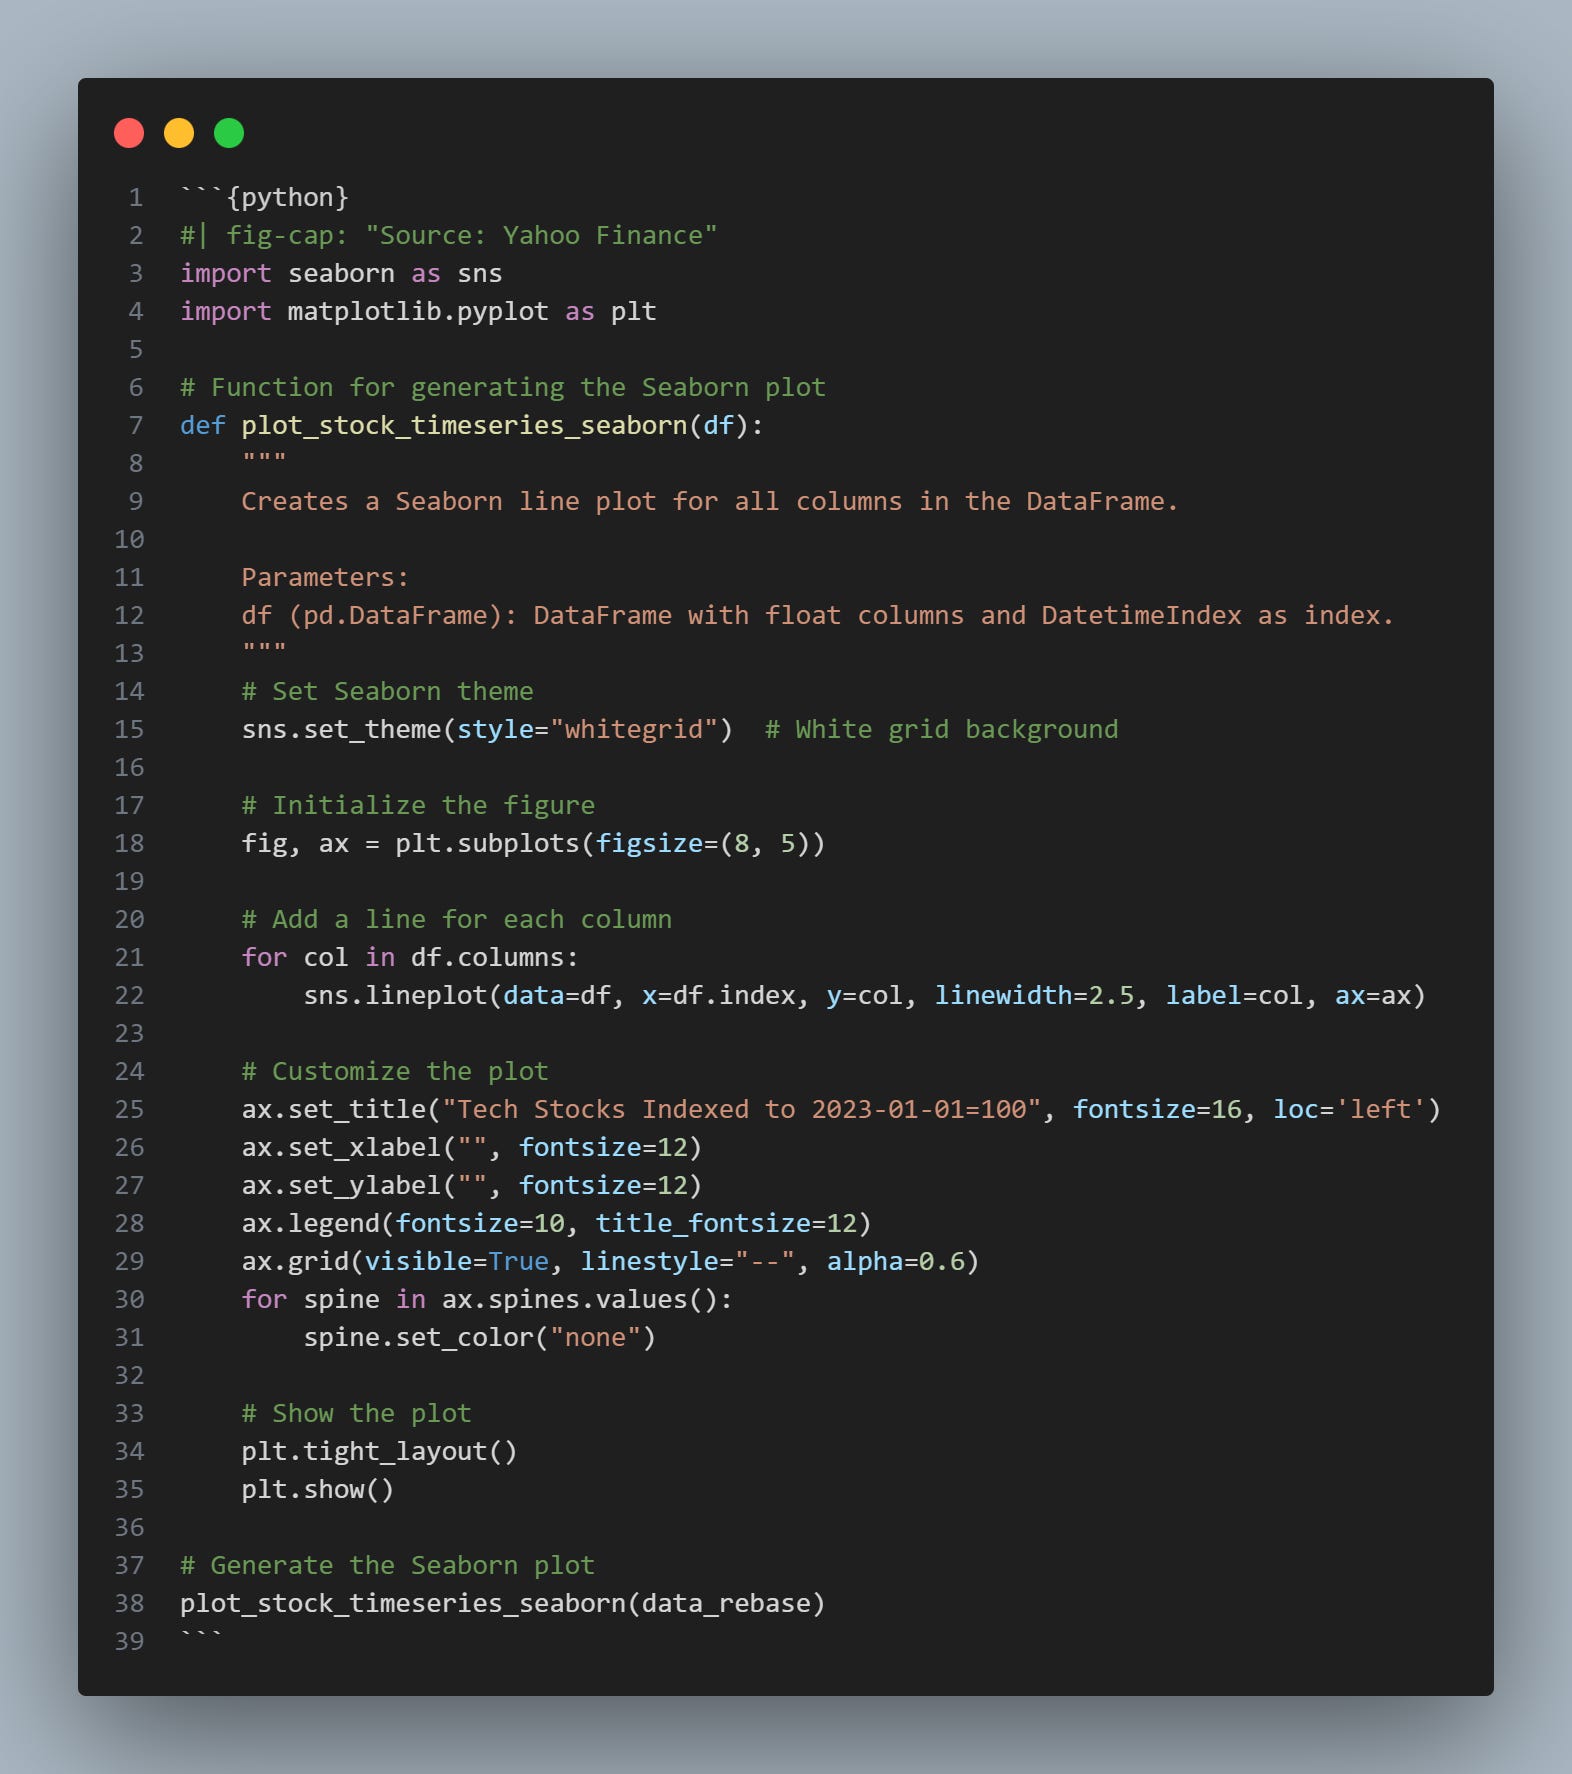
I also include a third code block to print the current timestamp, so readers know exactly when the report was last updated.

Step 2: Set up the workflow file
The workflow file is a YAML file (daily_report.yml) providing detailed instructions for GitHub Actions. We'll orchestrate several steps, as highlighted previously in the flow diagram.
First, grant permission to write to the GitHub repository, as the workflow needs to push changes to the static HTML files in the docs folder to update the web page.
...
permissions:
  contents: write     # Add permission to write to repository
...
Next, instruct GitHub Actions to use the Quarto library to render the report. It automatically executes and renders the Python code blocks from the report.qmd file created in step 1.
...
# Set up Quarto
- name: Set up Quarto
  uses: quarto-dev/quarto-actions/setup@v2

# Render Quarto Project
- name: Render Quarto Project
  run: quarto render
...
After running quarto render and updating the HTML files with the latest charts, we'll add changes to the docs folder, commit them, and push these updates back to the repository with a commit message that includes the current date.
...
# Configure Git and commit changes
- name: Configure Git and Push Changes
  run: |
    git config --global user.name 'github-actions[bot]'
    git config --global user.email 'github-actions[bot]@users.noreply.github.com'
    git add docs/*  # Add the rendered Quarto site in docs folder
    git commit -m "Update docs $(date +'%Y-%m-%d')"
    git push
...
Lastly, we'll instruct GitHub Actions to upload the generated data files (e.g., CSV files) as "artifacts," accessible in GitHub once the workflow completes.
...
- name: Upload CSV and plot as artifacts
  uses: actions/upload-artifact@v4
  with:
    name: data-files
    path: |
      data/raw/*.csv
      data/processed/*.csv
...
Step 3: Push to GitHub and test
Finally, create a repository on GitHub for your project to test the workflow.
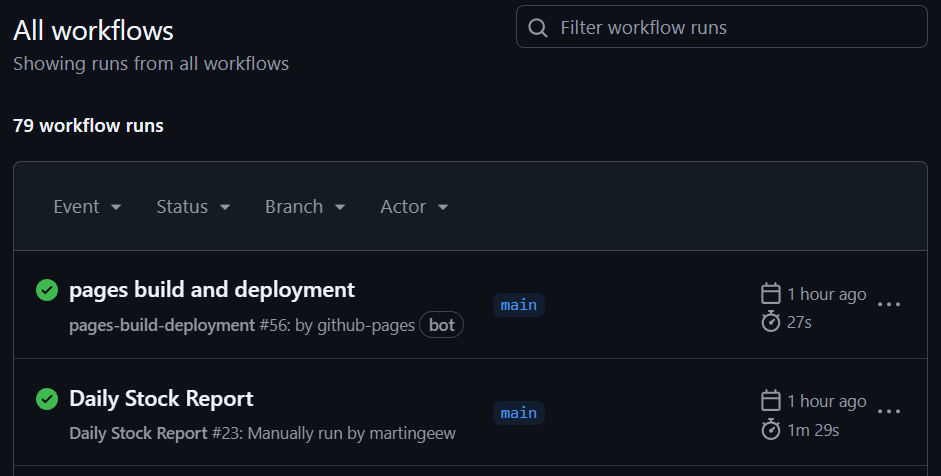
On the "Actions" tab of your repository, you'll see a "Run workflow" button. Click it to trigger the task manually. After completion, verify that the docs folder has been added or updated in your repo in the “Code” tab.

If you haven´t done so yet, configure GitHub Pages in the “Settings” tab to point to the docs folder of your repository (refer to this guide).
The workflow "pages build and deployment" will automatically start and deploy your website. Click on the completed workflow to find the link to your published report.
Note: If you need a private website that's restricted to users in your business or organization, GitHub also offers this option in their enterprise tier.
Formatting basics with Quarto
The Quarto website provides a clean, minimal theme out of the box, but here are a few customizations I added to my demo site:
Display a block-style banner for your report title
Include the author's name
Automatically show today's date
Add a footer (see the custom html footer file in the GitHub repo)3
To do the above, I add the following snippet at the start of the report.qmd file:
---
title: "Automated Data Report"
format:
  html:
    code-fold: true
title-block-banner: "#f0f3f5"
title-block-banner-color: "black"
author:
  name: "Martin Wong"
date: today
jupyter: python3
include-after-body: "footer.html"
---
You can also add tabs for quick navigation by inserting the following snippet into your report.qmd file. Each heading indicates the start of a new tab section.
::: {.panel-tabset .nav-pills}

## Daily indicators
If you're looking for more customization, Quarto also offers several pre-built themes: Quarto HTML Themes.
Bonus: How to use API keys with GitHub actions
Some APIs, such as FRED, require an API key. You can easily store these keys as environment variables, allowing you to automate data extraction with them in your GitHub Actions workflow.
Keep reading with a 7-day free trial
Subscribe to Autonomous Econ to keep reading this post and get 7 days of free access to the full post archives.